
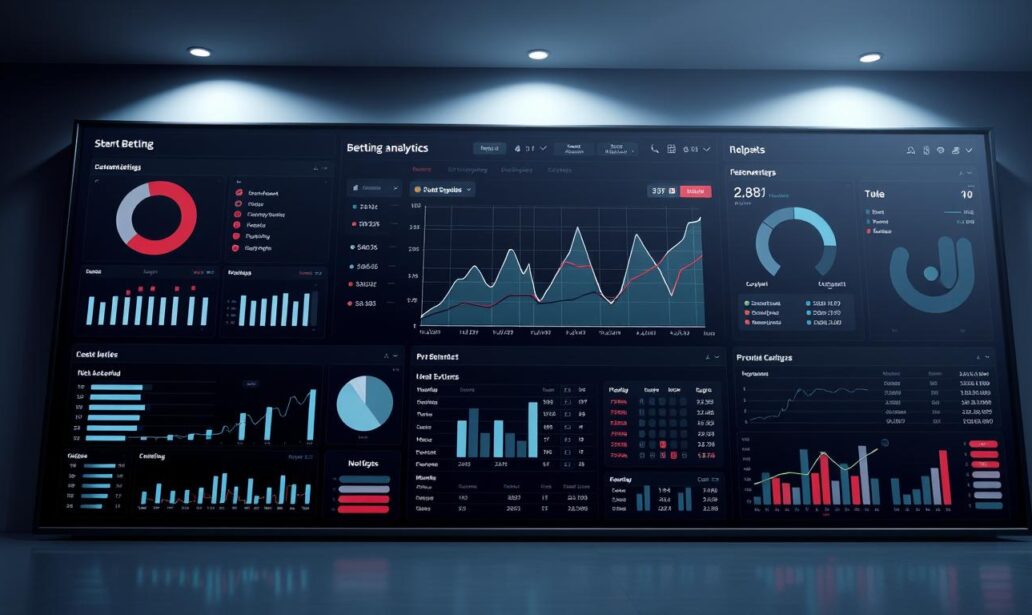
Today’s winners rely on cold, hard analytics, not superstition. It’s like having a calculator in a knife fight. The house advantage doesn’t seem so big anymore.
McKinsey research shows companies using analytics are 23 times more likely to get customers. That’s not just growth – it’s domination.
Data-driven betting turns gamblers into strategists. You know why you win and why you lose. This knowledge is key.
Every click, every wager, every hesitation is valuable info. It’s not just about winning more. It’s about playing smarter.
Welcome to the new currency of gambling. It’s not cryptocurrency – it’s information.
Tools for Data Analysis
Forget tarot cards and tea leaves; modern analytical tools offer predictions backed by actual math and science. We’re talking about software that can analyze patterns better than your most obsessive sports fan analyzing last season’s stats.
The landscape of analytical tools has evolved from simple spreadsheets to sophisticated platforms that feel like they belong in a sci-fi movie. Google Analytics remains the reliable workhorse – it’s like that friend who always shows up on time but never brings the good snacks to the party.
Then there’s Tableau, the Picasso of data visualization. This tool transforms boring numbers into visual masterpieces that even your art-averse CFO would appreciate. It makes data storytelling accessible to everyone.
Microsoft’s Power BI plays the corporate game like a seasoned politician. It integrates seamlessly with Office products while providing serious analytical muscle. It’s the tool that makes boardroom presentations actually compelling.

But the real game-changers are the AI-powered predictive tools. These aren’t just analytical tools; they’re digital fortune tellers with PhDs in statistics. They can analyze historical data, identify patterns, and predict outcomes with unsettling accuracy.
The beauty of modern analytical tools lies in their accessibility. You don’t need to be a data scientist to harness their power. Most platforms offer intuitive interfaces that make complex analysis feel like using your favorite social media app.
| Tool | Best For | Learning Curve | Predictive Capabilities |
|---|---|---|---|
| Google Analytics | Web traffic analysis | Low | Basic |
| Tableau | Data visualization | Medium | Moderate |
| Power BI | Business intelligence | Medium | Advanced |
| AI/ML Platforms | Predictive analytics | High | Exceptional |
When selecting your analytical tools, consider your specific needs. Are you tracking website performance? Analyzing customer behavior? Predicting market trends? Each tool has its specialty, like different instruments in an orchestra.
The most effective approach often involves using multiple tools in concert. Google Analytics for baseline data, Tableau for visualization, and specialized AI tools for predictions. This combination creates a comprehensive data analysis toolkit that covers all your analytical needs.
Remember: the best analytical tools are the ones you’ll actually use. Fancy features mean nothing if the interface gives you migraines. Choose tools that match your technical comfort level while pushing your analytical capabilities forward.
These tools represent the democratization of data analysis. What was once reserved for statisticians in ivory towers is now accessible to anyone willing to learn. The playing field has been leveled, and the insights are waiting for those smart enough to grab them.
Real-world Implementation
Implementation is where your data strategy meets real-world challenges. It’s like your business plan’s first day at high school.
Here’s a four-step process to help you succeed:
- Determine actual goals – “Make more money” is vague. Are you aiming for brand awareness, customer retention, or lower costs? Be specific to avoid failure.
- Create meaningful KPIs – Metrics like click-through rates and customer lifetime value guide your decisions. They help you navigate through data.
- Analyze with brutal honesty – This step reveals the truth about your campaigns. The data shows what really works, even if it’s hard to accept.
- Optimize relentlessly – The best strategies evolve with data. They change based on what actually works, not just what looks good.

Netflix is a great example of mastering implementation. Their recommendation engine is a decision-making tool that suggests content based on your viewing habits. It’s so accurate, it feels like magic.
Netflix’s secret is ongoing dialogue with data. When you binge-watch true crime documentaries, they make more true crime content. They don’t just note your preference; they act on it.
This approach turns data into a competitive edge. It’s the difference between knowing your audience and truly understanding them.
The real magic is in seeing implementation as a journey of discovery. Your first ideas will likely be wrong. That’s where the real insights are.
Quality implementation means being brave enough to change when data shows you’re wrong. It’s not about being right at first. It’s about refining your approach over time.
This disciplined approach to decision-making sets apart organizations that just collect data from those that use it to achieve real results.
Developing a Data-driven Mindset
Getting into data-driven betting isn’t about turning into a robot. It’s about becoming smarter at making choices. It’s like learning to speak probability fluently while keeping your critical thinking sharp. The change happens when you stop relying on feelings and start looking at the data.
This change needs more than just new tools. It’s about making evidence the guiding light in your decisions. Think back to that time your weather app said it wouldn’t rain, but it did. That’s your intuition – often wrong but always sure.
The first step is building the three pillars of data-driven decision making:
| Traditional Approach | Transition Phase | Data-Driven Mindset |
|---|---|---|
| Gut feelings and hunches | Data-supported intuition | Evidence-based decisions |
| Reactive adjustments | Periodic reviews | Continuous feedback loops |
| Isolated information | Department-level data | Organization-wide culture |
| Fixed strategies | Adjustable plans | Agile methodology |
Creating a data strategy isn’t about collecting everything. It’s about getting the right data. You need to find out what really matters, not just what looks good on a chart. This means linking data to your business goals, not just collecting for the sake of it.
“Without data, you’re just another person with an opinion. With data, you’re someone with evidence.”
The best at data-driven betting see numbers as stories. But they know there’s more to the story. They see a 2% conversion rate as a chance, not a failure. They spot patterns where others see only chaos.
This mindset turns uncertainty into something you can measure. You stop fearing risk and start working with it. The data doesn’t make the gamble go away; it just makes it more likely to succeed.
True data-driven betting mastery happens when numbers become insights, not just reports. When your whole team lives and breathes data. That’s when you go from playing the game to understanding it.
Challenges and Solutions
Data overload is like trying to drink from a firehose. You get overwhelmed, but you don’t really absorb much. The key is to focus on the metrics that matter most.
Poor data quality makes decision-making a high-risk gamble. Remember, garbage in, garbage out is a real cost. You need validation and governance to avoid making wrong choices.
GDPR and privacy rules are not just suggestions. They are essential to avoid huge fines. Create a culture where everyone is responsible for data, not just a few.
Your analytical tools are only as good as the data they use. A weak foundation makes even the best decisions useless. It’s about building a strong data house that can withstand challenges.