

Let’s be honest. Betting on a “hunch” is as reliable as a fortune cookie about love. We’ve moved beyond that.
In today’s world, Moneyball and fantasy sports algorithms rule. The real edge isn’t luck. It’s in the data. Successful analysts manage their bets like a portfolio.
Think of your betting history as a quarterly report. Is your strategy making money, or just on a streak? Without the right numbers, you’re lost.
A clear dashboard of betting KPIs is your best tool. These metrics are your strategy’s heartbeat. They turn hope into insight and chance into probability.
We’re going to build that dashboard together. Buckle up. We’re turning data into your most valuable asset.
Essential Betting Performance Indicators
Tracking your betting performance without the right metrics is like trying to bake a cake without a recipe—you might get something edible, but it won’t be consistent. Are you winning because of skill or a lucky parlay? Without the proper indicators, you’re flying blind.
Think of these metrics as your cockpit instruments. The win/loss tally is just your airspeed. You also need altitude, fuel, and heading. Your essential dashboard tells the full story.
This dashboard of performance tracking breaks down into four critical quadrants. We measure frequency, profitability, market intelligence, and risk. Ignoring one is like ignoring a warning light on your dashboard.
Let’s map out the 11 key instruments every analytical bettor needs. The table below organizes them by their primary function in your strategy.
| Metric Category | Key Indicators | What It Measures | Why It Matters |
|---|---|---|---|
| Frequency | Win Rate, Strike Rate, Hit Rate | How often your bets are successful | Separates consistent strategy from lucky streaks. A high win rate with low odds means little. |
| Profitability | ROI, Yield, Bankroll Growth | The actual financial return on your wagering activity | The bottom line. You can win often and lose money if sizing is wrong. |
| Market Intelligence | Closing Line Value (CLV), Edge, Average Odds | Your ability to beat the closing market price | This is the true test of predictive skill. Beating the closing line is the holy grail. |
| Risk Management | Bankroll Management, Largest Loss, Betting Variance | The volatility and downsides of your approach | Prevents catastrophic ruin. Tells you if wins are sustainable or risky gambles. |
See the pattern? Each category answers a different question. Frequency asks, “Am I right often?” Profitability asks, “Am I making money?” Market intelligence asks, “Am I smarter than the market?” Risk management asks, “Can I survive being wrong?”
Your Win Rate might be 60%, which sounds fantastic. But if your Average Odds are 1.20, you’re barely treading water. That’s why single metrics lie.
Also, a stunning ROI this month is meaningless without checking your Largest Loss and Variance. One bad week could erase those gains if your risk is uncontrolled.
The key is synthesis. Your performance tracking system must connect these dots. It’s the difference between having data and having insight.
Start by building this framework. Before you obsess over decimal points in your ROI, make sure you’re tracking all four categories. Your future self will thank you during the inevitable losing streak.
Consistent performance tracking across these indicators turns gambling into a measurable strategy. It’s how you prove you’re a strategist, not a lottery winner.
Return on Investment (ROI) Calculations
ROI doesn’t care about your gut feelings or winning streaks. It only looks at cold, hard percentages. This is the key betting analytics metric, showing if you’re making money or just wasting it.
The calculation is simple: (Net Profit / Total Staked) × 100. No fancy algorithms needed. Just your profit and what you risked, as a percentage.

Many bettors focus too much on win percentage. But in value betting, ROI and win rate can go in opposite directions. You can win a lot but lose money, or win less and make more.
Here are two examples:
- The “Winner’s Curse” Bettor: Wins 75% of bets at 1.30 odds. After 100 bets of $100 each, they’ve won $9,750 but staked $10,000. Their ROI? -2.5%. They’re winning but getting poorer.
- The Value Hunter: Wins 42% of bets at 3.00 odds. Same 100 bets of $100 each. They’ve won $12,600 against $10,000 staked. Their ROI? +26%. They lose more often but profit more.
ROI is the top betting analytics metric. It answers the only question that matters: Are you growing your bankroll?
A good ROI tells a strong story. A 5% ROI over 1,000 bets means you have a real edge. It’s not just luck—it’s value extraction.
But a 50% ROI over 10 bets is just luck. It’s not a real edge. The market hasn’t noticed your brilliance yet.
When tracking your ROI, keep these benchmarks in mind:
- Professional Standard: A 3-7% ROI is the mark of a sharp bettor
- Breaking Even: 0% ROI means you’re just paying for fun
- Warning Zone: Negative ROI over 500+ bets shows strategy flaws
- Sustainable Growth: Positive ROI that grows over time is the goal
ROI is honest. It can’t be faked or spun. Your bankroll either grows or it doesn’t. Your bets either add value or destroy it.
So, next time you brag about your win percentage, ask yourself the ROI question. Profitability isn’t about winning often. It’s about keeping what you win.
Closing Line Value (CLV) Analysis
Let’s get to the point. ROI shows how your betting story ends. Closing Line Value (CLV) tells if you were smart or just lucky. It’s not just a number; it shows your skill in predicting outcomes.
So, what is CLV? Simply, it’s the difference between your bet odds and the final odds before the event. It’s like a report card on your timing. A positive CLV means you bet at better odds than the final line. You found a good value early on.
A negative CLV is like buying a concert ticket from a scalper after the show starts. You paid too much for something the market already knew.
The closing line is like the smartest advice from everyone in the betting world. It’s the best price available. Beating it means you’re smarter than the crowd. You see the storm coming while others look at sunny skies.
Tracking CLV helps you know if you’re a true analyst or just hoping to win. It tells if your “edge” is real or just luck.
Here’s the key. A consistently positive CLV is the ultimate goal. It shows your research and models find value early. You buy low, before prices go up.
A consistently negative CLV is a warning sign. It means you often bet on what everyone else thinks or chase prices that have already moved. You’re buying high. This is bad in stocks and betting.
This metric makes you disciplined. It doesn’t care about winning or losing. It only looks at if you were smarter than the final market price. Did you spot what others missed? That’s the question for any serious bettor.
Strike Rate and Win Percentage
Let’s get real: your win percentage is overrated. It’s like the quarterback rating, distracting from what really matters—making money. Everyone brags about their 65% strike rate, but it doesn’t show how well you’re doing financially.
Strike rate, or win percentage, is just how often you win. It’s like a sports betting batting average. It feels good, but don’t build your whole identity on it. The real goal is how much you make when you win and how little you lose when you don’t.
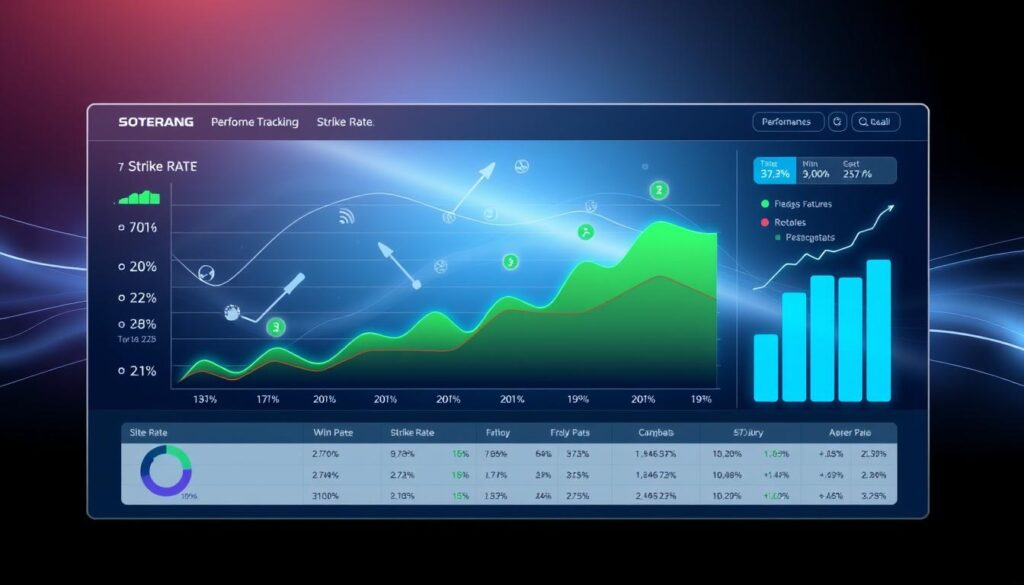
Here’s the harsh truth. A 70% strike rate might sound amazing. But betting -300 favorites means you’re supposed to win 75% of the time. This “legendary” rate is just what’s expected. You’re basically working for the sportsbook, making small profits while risking big losses.
Now, think about betting less often but making more when you do. A 40% strike rate at +250 odds might seem bad. But each win can pay 2.5 times your stake. This can lead to big profits. Understanding this is key to performance tracking.
So, why bother with this metric? Here are three good reasons:
- Emotional Calibration: Knowing your win rate helps you handle losing streaks. If you usually win 55% of the time, a 1-5 stretch is just normal variance.
- Strategy Validation: Your strike rate shows what kind of bettor you are. Are you a high-probability, low-return player or a low-probability, high-return hunter?
- Bet Sizing Input: Your confidence in a pick should be based on past performance, not just gut feeling.
Effective performance tracking isn’t about winning all the time. It’s about checking your decision-making. A high strike rate with poor odds is like a restaurant with many customers but small profits—it looks good until the bills come.
This is where bankroll management comes in. A volatile strategy needs smaller bets to survive. A consistent strategy might allow for bigger bets. Your win percentage alone can’t tell you how much to bet. You need the whole picture.
Think of your strike rate as one part of your performance tracking system. The speedometer shows your win rate, but you also need the fuel gauge (bankroll), odometer (total units won), and engine temperature (variance) to navigate safely.
The goal is to find the right balance between winning often and making a lot when you do. This is the profitable balance that turns activity into profit. It’s different for everyone.
In the end, your win percentage is a tool, not a goal. Track it carefully, analyze it deeply, but don’t worship it. The best performance tracking metric is how much you make when you win and how little you lose when you don’t. That’s what pays the bills.
Average Odds and Bet Sizing Metrics
Betting is like a poker game, where your average odds show if you’re playing safe or taking big risks. It’s not about if you’re right or wrong. It’s about knowing what your numbers say about you. Are you playing it safe with -200 favorites or taking big risks on +500 underdogs?
There’s no one-size-fits-all answer. What matters is being consistent. The key is to match your average odds with your win rate. Think of it like dating. If you’re always chasing high odds but losing, it’s time to adjust your approach.
Let’s talk numbers. If your winning odds are +150 but your win rate is 30%, something’s not right. You might be overestimating your skills or underestimating chance. This mismatch is a common problem for analytical bettors.
Your average odds metric is a key part of your betting analytics metrics framework. It helps you turn “I think this team will win” into “how much should I bet?” Without it, you’re just betting blindly.
There are three main betting types based on average odds:
- The Value Conservative: Average odds -150 to -200, win rate 60-70%. They look for small value in favorites.
- The Balanced Hunter: Average odds +100 to +150, win rate 45-55%. They mix favorites and underdogs for value.
- The Longshot Specialist: Average odds +250 or higher, win rate 25-35%. They take big risks for big wins, needing to spot great value.
Each type can be profitable with the right bet sizing. This metric guides your strategy. It helps you decide how much of your bankroll to risk on each bet.
Betting the same amount on a -300 favorite and a +400 underdog is crazy. It’s like using the same fishing rod for small fish and sharks. Your bet size should match the odds and your confidence.
Let’s look at a real example. Say your data shows:
- Average winning odds: +120
- Overall win rate: 48%
- Average losing odds: -140
This means you’re finding slight value on underdogs but overpaying for favorites. Your bet sizing metrics should reflect this. You might bet more on underdogs and less on favorites.
This turns abstract ideas like “value” and “edge” into real money amounts. A +180 line means more than just profit. It’s a specific percentage of your bankroll. This is where analytics pays off.
Remember our talk about Closing Line Value? Average odds are where CLV meets money. Finding a line that moves from +150 to +120 is rewarding. Knowing how to bet it right is what makes you money.
Keep track of these metrics:
- Average odds of all bets placed
- Average odds of winning bets versus losing bets
- Win rate at different odds ranges (-200 to -150, -149 to +100, etc.)
- Return at different odds ranges (where are you actually making money?)
You’ll find surprising patterns. Maybe you’re great at +110 to +130 but bad beyond +200. Those -250 “locks” might be draining your bankroll. Knowing this separates pros from hobbyists.
In the world of betting analytics metrics, average odds and bet sizing are key. They ensure you’re making money, not just winning bets. Because in the end, that’s what matters most.
Your average odds reveal your betting identity. Your bet sizing determines if that identity is profitable or just expensive fun. Get this right, and you’ll grow your bankroll with analytical insights.
Bankroll Growth Rate Tracking
If your betting operation were a publicly traded company, the Bankroll Growth Rate would be the headline figure on every quarterly earnings call. Forget the absolute dollar amount—that’s just vanity metrics for amateurs. The sophisticated analyst cares about one thing: the percentage. Turning $1,000 into $1,100 is the same 10% growth as turning $100 into $110. The principle is identical, but the discipline required is monumental.
This metric is the ultimate governor against our own worst instincts. It transforms us from gamblers into portfolio managers. When you track growth rate, you’re forced to adopt proportional staking—that sacred 1% to 5% per bet rule isn’t just advice; it’s a mathematical commandment for survival. It makes “revenge betting” after a loss look as foolish as a hedge fund manager doubling down on a failing stock because they’re angry at the market.
Think of your bankroll as a tiny, speculative investment fund. Your analytical skill is the primary asset. The growth rate tells you how well that asset is performing. A consistent 5% monthly growth is world-class. A sporadic month of 20% gains followed by a 15% loss is a red flag screaming “variance” or, worse, “poor discipline.”
Let’s make this concrete. The table below shows why focusing on the rate, not the raw cash, is the core of this betting KPI. Three different bettors, three different journeys.
| Bettor Profile | Starting Bankroll | Avg. Monthly Growth Rate | Bankroll After 6 Months |
|---|---|---|---|
| The “Steady Eddy” (Proportional Bettor) | $500 | +8% | $793 |
| The “Aggressive Alice” (Chases Losses) | $1,000 | +15%, -10%, +25%, -20% (Volatile) | $1,035 |
| The “Conservative Chris” (Under-bets) | $200 | +3% | $239 |
See the story? “Aggressive Alice” started with twice the capital of “Steady Eddy,” but her volatile, undisciplined approach left her with barely more growth. Eddy’s strict adherence to a system and a consistent rate compounds quietly and effectively. Chris is safe but isn’t maximizing his edge. The growth rate metric exposes these strategic truths instantly.
Tracking this rate is the job of your inner CFO. It answers the only question that matters in the long run: Is my methodology sustainably growing my capital? It silences the noise of daily wins and losses and forces a macro view. Are you running a sprint toward burnout or a marathon toward sustained profitability? Your bankroll growth rate is the pacemaker keeping your heart in the race.
Integrating this tracking metric into your weekly review is non-negotiable. It’s the clearest, most honest reflection of whether your analytical work is translating into financial progress. Without it, you’re just keeping score. With it, you’re building equity in your own intelligence.
Drawdown Analysis and Recovery
Performance tracking isn’t just about celebrating wins; it’s about dissecting losses with precision. Every strategy will hit rough patches. Your bankroll isn’t a straight line heading north—it’s a jagged graph with peaks and valleys.
That’s where drawdown analysis comes in. It’s like a stress test for your strategy. A drawdown is the peak-to-trough decline in your betting capital. It’s that sinking feeling when a hot streak turns ice cold.
Why obsess over the lows? Because how you handle drawdowns defines your long-term success. Was this dip caused by normal variance, or did you abandon your model and chase losses? Honest analysis here prevents catastrophic errors later.
This is where your performance tracking gets serious. You need to measure three key things: the depth (how far you fell), the duration (how long it lasted), and the recovery (how you climbed back). Tracking your “Largest Loss” as a standalone KPI is a good start, but it’s only part of the story.
Let’s talk psychology. A steep, fast drawdown feels like a punch to the gut. A long, slow bleed tests your patience. Your reaction in these moments—sticking to your unit size or panicking—reveals everything. This analysis isn’t just number crunching; it’s a mirror held up to your discipline.
So, how do you build a recovery plan? First, know your numbers. If your typical drawdown is 20% over two weeks, you shouldn’t double your bets after a 10% loss in three days. That’s variance, not a system failure.
Your performance tracking spreadsheet needs a dedicated recovery column. How many winning bets at your average odds did it take to get back to even? This metric is brutally honest. It tells you if your edge is strong enough to withstand the inevitable storms.
Consider this simple framework for analyzing different drawdown scenarios:
| Drawdown Type | Depth | Likely Cause | Recovery Mindset |
|---|---|---|---|
| Sharp & Short | 15-25% | Bad variance cluster | Stay the course |
| Slow & Steady | 10-15% over weeks | Market correction | Review model assumptions |
| Deep & Prolonged | 30%+ | System failure or emotional betting | Full strategy audit required |
The table isn’t just data—it’s a diagnostic tool. Matching your current slump to a known pattern removes the fear of the unknown. You’re not lost in the woods; you’re consulting a map.
Ultimately, drawdown analysis is your betting strategy’s immune system. By studying how it responds under pressure, you build resilience. You set realistic expectations. You avoid the panic that turns a temporary dip into a permanent crater.
Embrace the valleys. They teach you more about your performance tracking rigor than the peaks ever will. The goal isn’t to avoid drawdowns—that’s impossible. The goal is to understand them so well that they never surprise you into making a stupid decision.
Variance and Standard Deviation
Welcome to the casino’s funhouse mirror. Variance is the statistical gremlin that warps your perception. A solid 55% win rate can look like a disastrous 30% month. Standard deviation is the ruler we use to measure this chaos.
Grasping these concepts separates the professional from the punter. Your betting analytics metrics might show a clear edge. Yet, you can lose money over a hundred wagers. That’s variance doing its disruptive dance.
Think of standard deviation as your financial weather report. It models the likely range of your returns. This calculation is the ultimate defense against panic. It stops you from torching a sound strategy after one bad week.
It also keeps you humble during a lucky streak. The math delivers a sobering truth. In the short game, luck shouts while skill whispers. Our mission is to ensure skill wins the long argument.
Integrating variance into your betting analytics metrics provides clarity. You stop chasing phantom patterns in random noise. You develop the patience of a chess master, not the frenzy of a slot machine player.
This is the final piece of the analytical puzzle. Track your standard deviation alongside your ROI and CLV. You’ll see your performance not as a jagged line, but as a predictable band of probable outcomes. The chaos becomes manageable. The noise fades. Only the signal of your true skill remains.